Power BI | KPI reporting | Time-series analysis | Resource monitoring
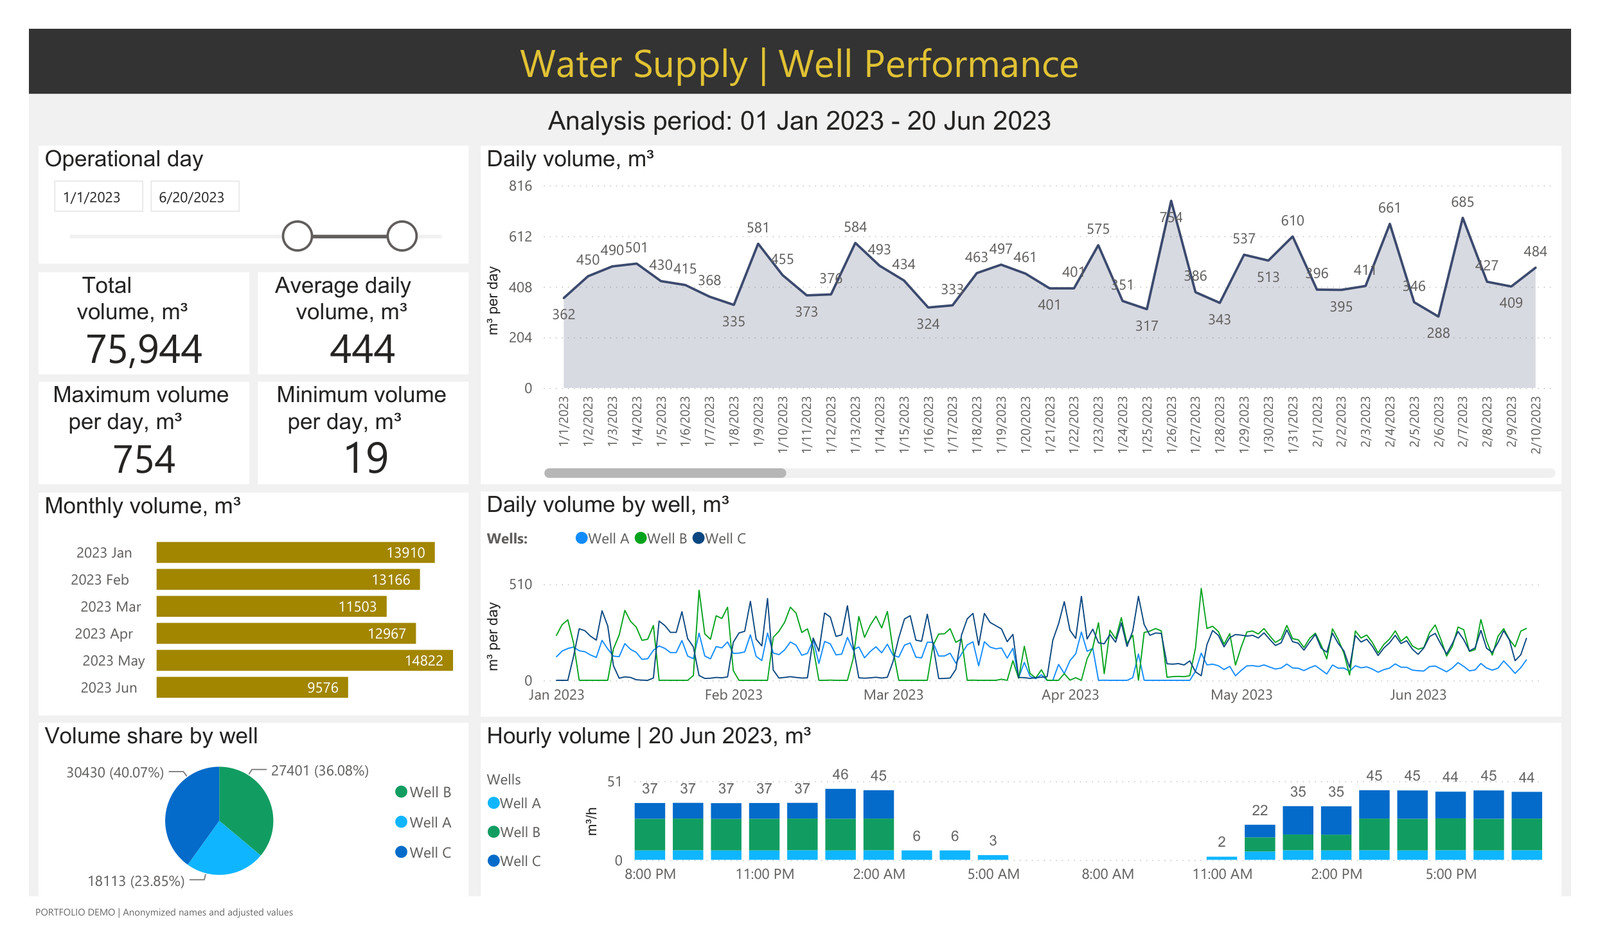
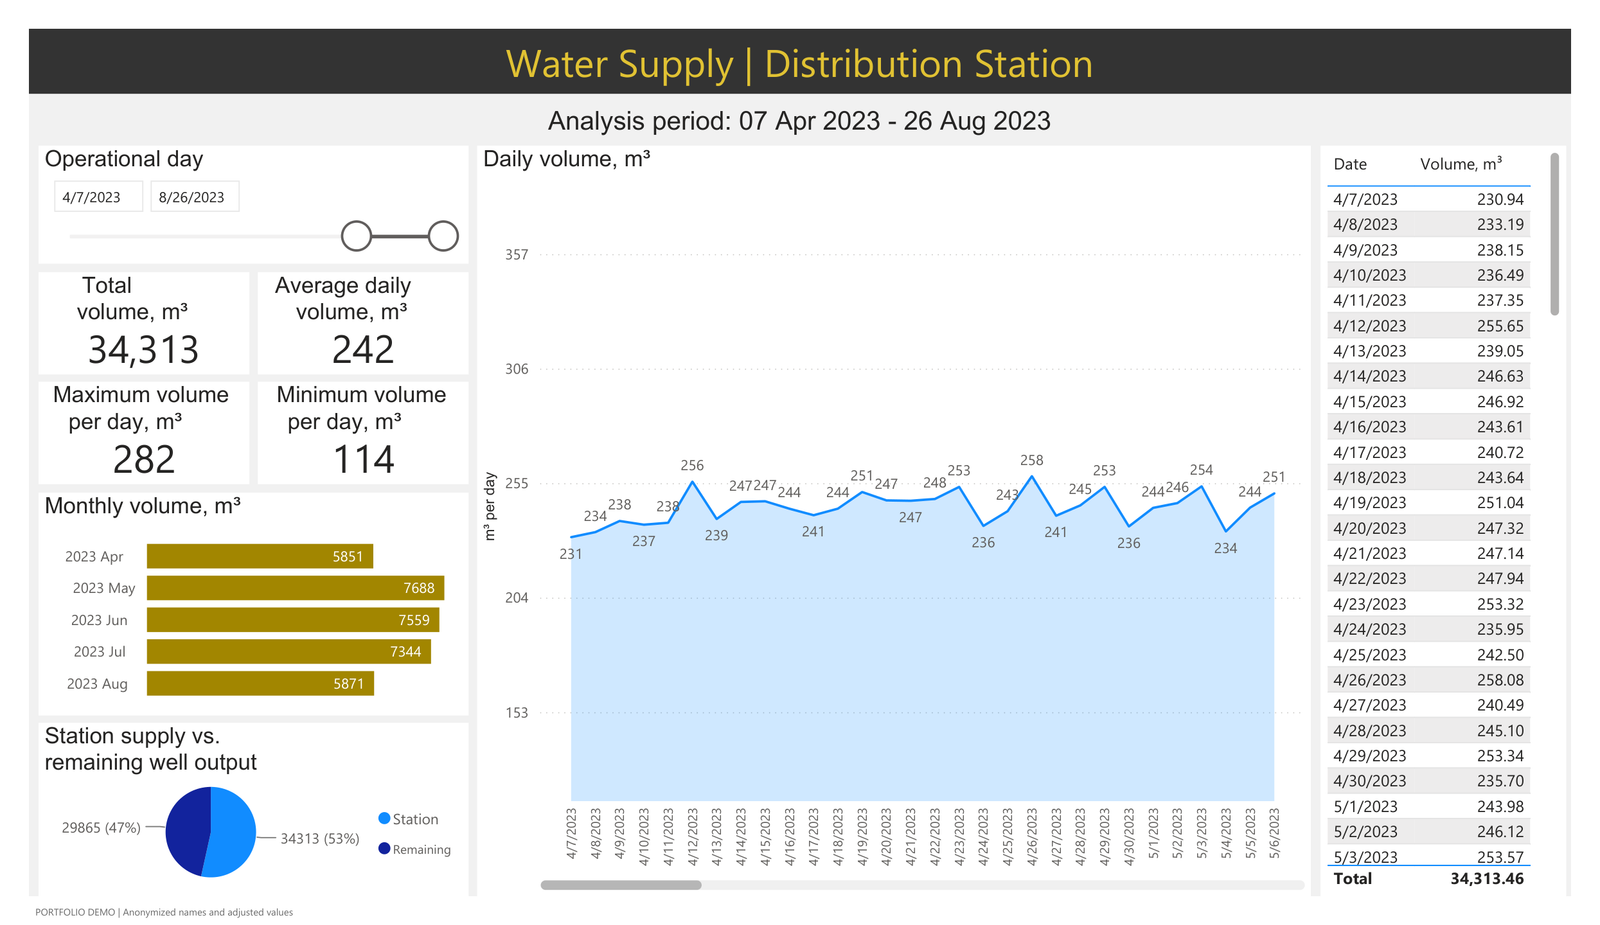
I built a Power BI dashboard that turns water meter readings into a clear view of supply volumes, daily trends and the contribution of each well. It brings well performance and a distribution station into one reporting workflow, making the data easier to understand and reducing the time spent preparing routine reports.
Business need
The team needed to understand how much water was supplied, how volumes changed over time and how output was distributed across wells. Reviewing individual readings made these questions harder to answer quickly.
Analytical approach
I organized the report around practical questions: What is the total volume for the selected period? What does a typical day look like? When do volumes peak or fall? Which wells contribute most to supply?
The dashboard combines total, average, maximum and minimum daily volumes with hourly, daily and monthly views. Users can compare individual wells, inspect changes over time and review the distribution station alongside the remaining well output. A detailed daily table supports checking the summary figures.
Outcome
The visual reporting made supply patterns and differences between wells easier to understand. Bringing the key figures and trends together reduced the time needed to prepare recurring reports and gave the team a shared view for day-to-day review.
Broader analytics relevance
This project demonstrates how I turn operational data into accessible business reporting: choosing useful KPIs, organizing time-series data at several levels of detail, comparing entities and connecting summary metrics to supporting records. The same approach applies to sales reporting, branch performance, service volumes and resource planning.
The screenshots use anonymized names and illustrative demo values. They show the report’s structure and analytical approach, rather than actual operational results.