Power BI · Excel · Service Operations · Reporting Workflows
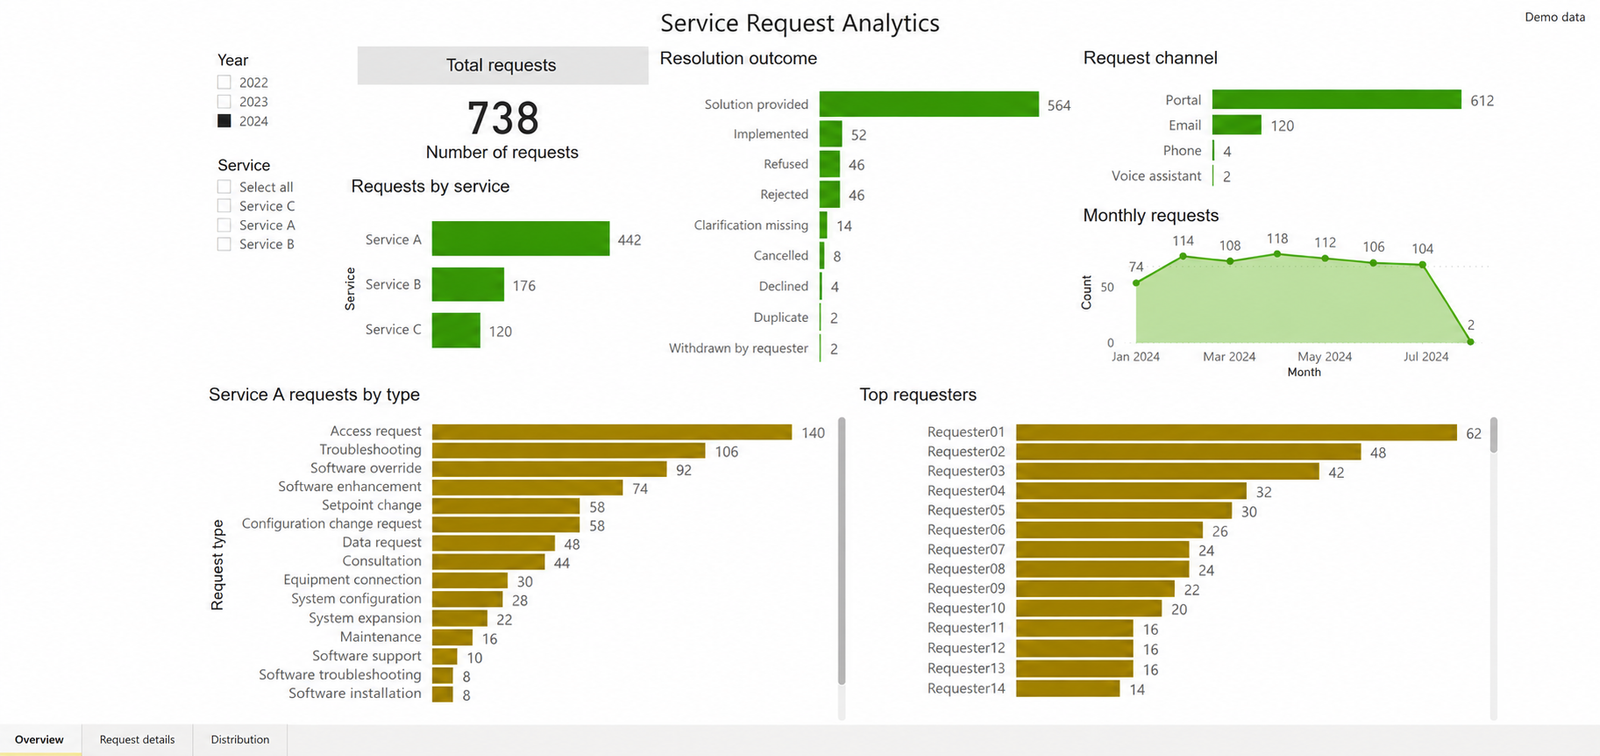
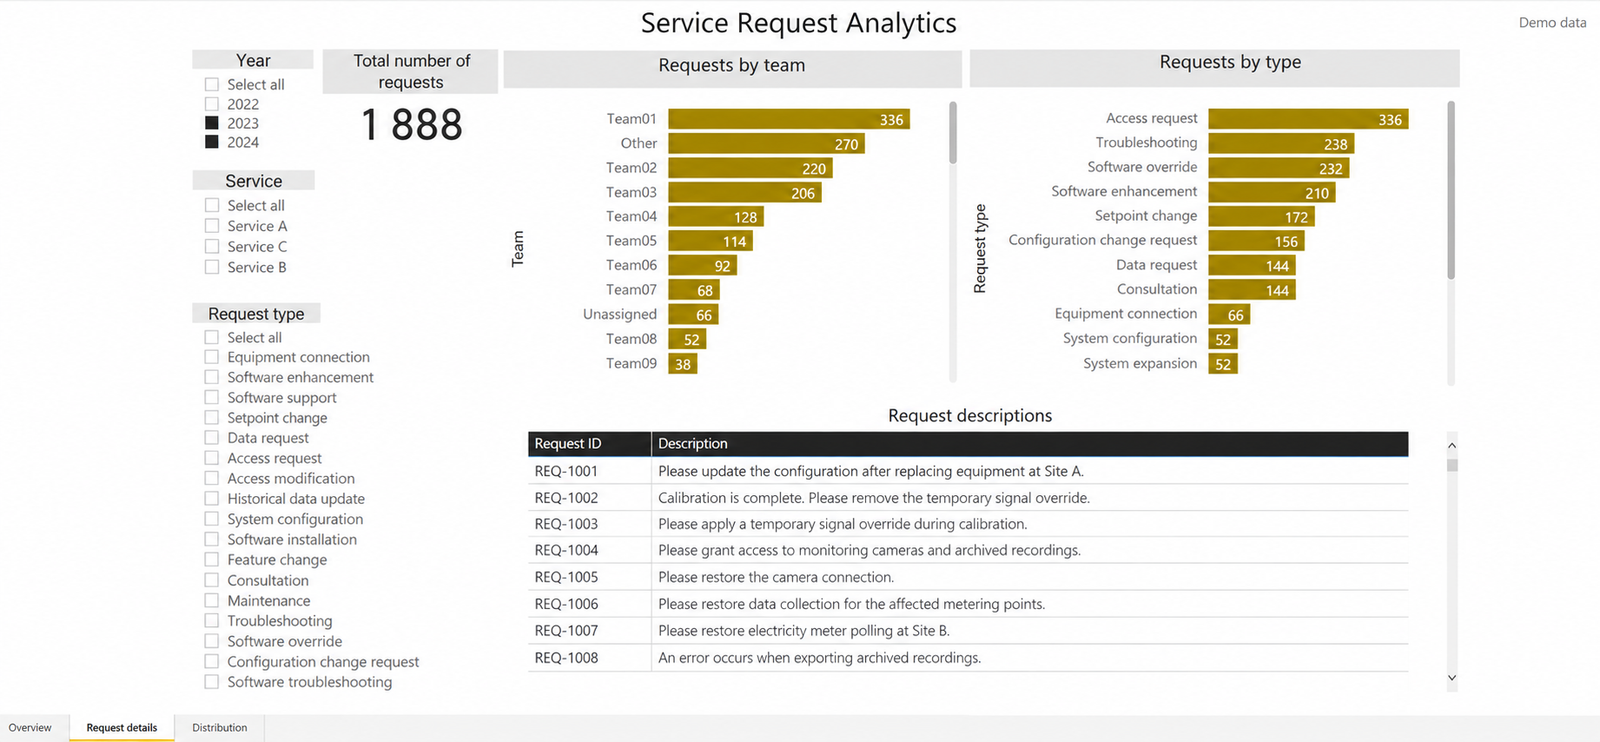
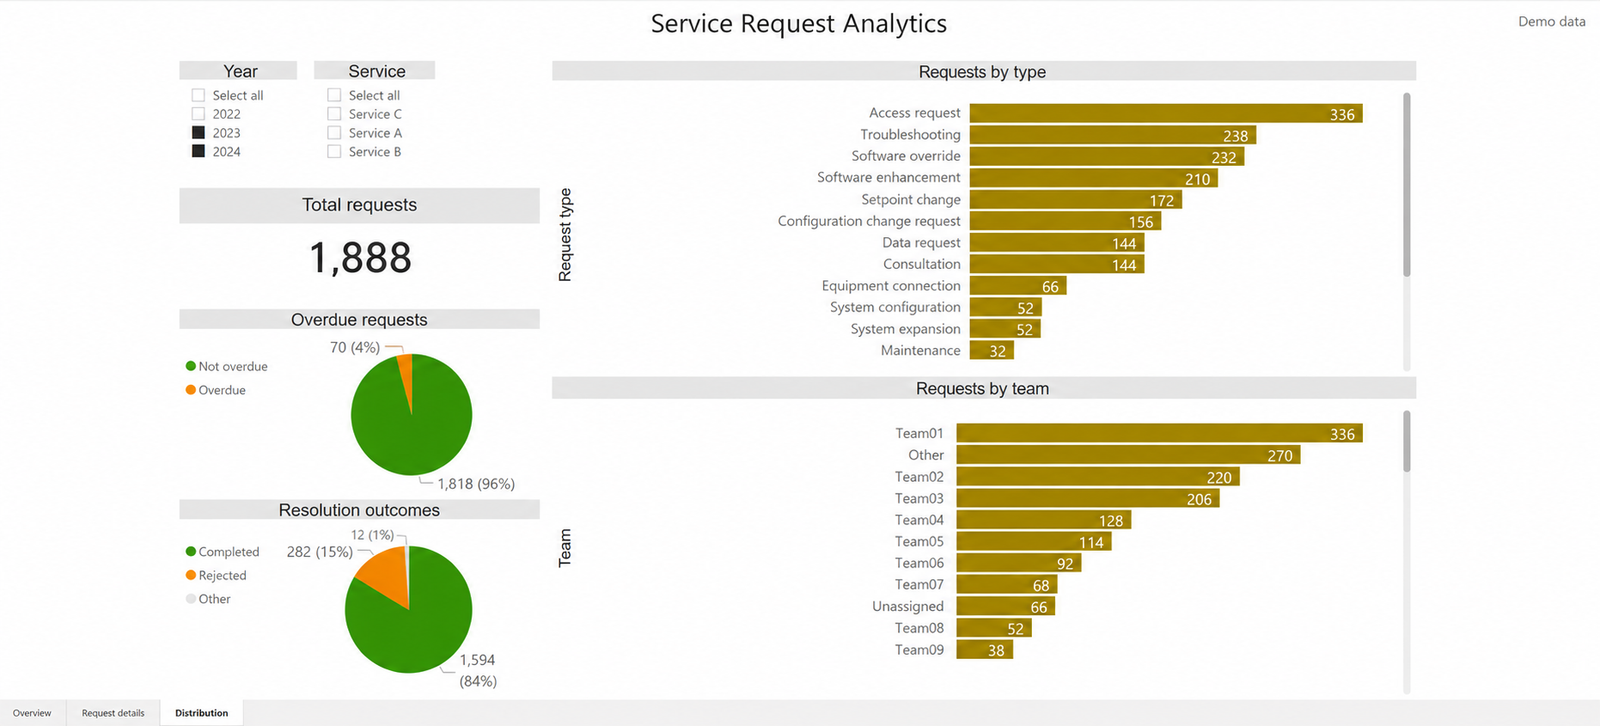
I built this report to bring service requests from three support services into one place. It connects request volumes, submission channels and resolution outcomes with the teams and people generating demand. Users can move from an overview to individual request descriptions, or compare request types and overdue status across selected periods.
The three pages answer practical questions: which services receive the most requests, what people ask for, how demand changes over time and how requests are handled. Filters support single or multiple selections, and clicking a bar narrows the other visuals to the selected category. This makes it possible to explore a pattern without losing the context behind it.
A practical constraint shaped the data workflow: a direct automated import from the service platform was not available. I configured the report around an Excel export placed in a shared folder. Users replace the export when new data is needed; the report refreshes from that location on a daily schedule. The source export remains a manual step, while the reporting process is repeatable.
This project demonstrates how I turn an existing business process into usable reporting, including the less visible work of making updates manageable. The same approach can support IT service desks, internal business services and customer support teams wherever request data needs to be compared, filtered and traced back to individual cases.
The images are edited portfolio illustrations with anonymized identities and altered demonstration values. They illustrate the original report’s analytical structure, rather than actual service performance.