Power BI | Utilization analysis | Status analysis | Decision support
I built a Power BI dashboard that gives process engineers a consolidated view of advanced process control performance. It shows how controller utilization changes over time and how operating time is distributed across statuses, helping the team understand where to focus its attention.
Business need
The existing SCADA screens supported operational monitoring, but did not give the team the same consolidated historical picture across controllers. Process engineers needed a way to compare performance, recognize recurring patterns and identify areas that deserved closer investigation.
Analytical approach
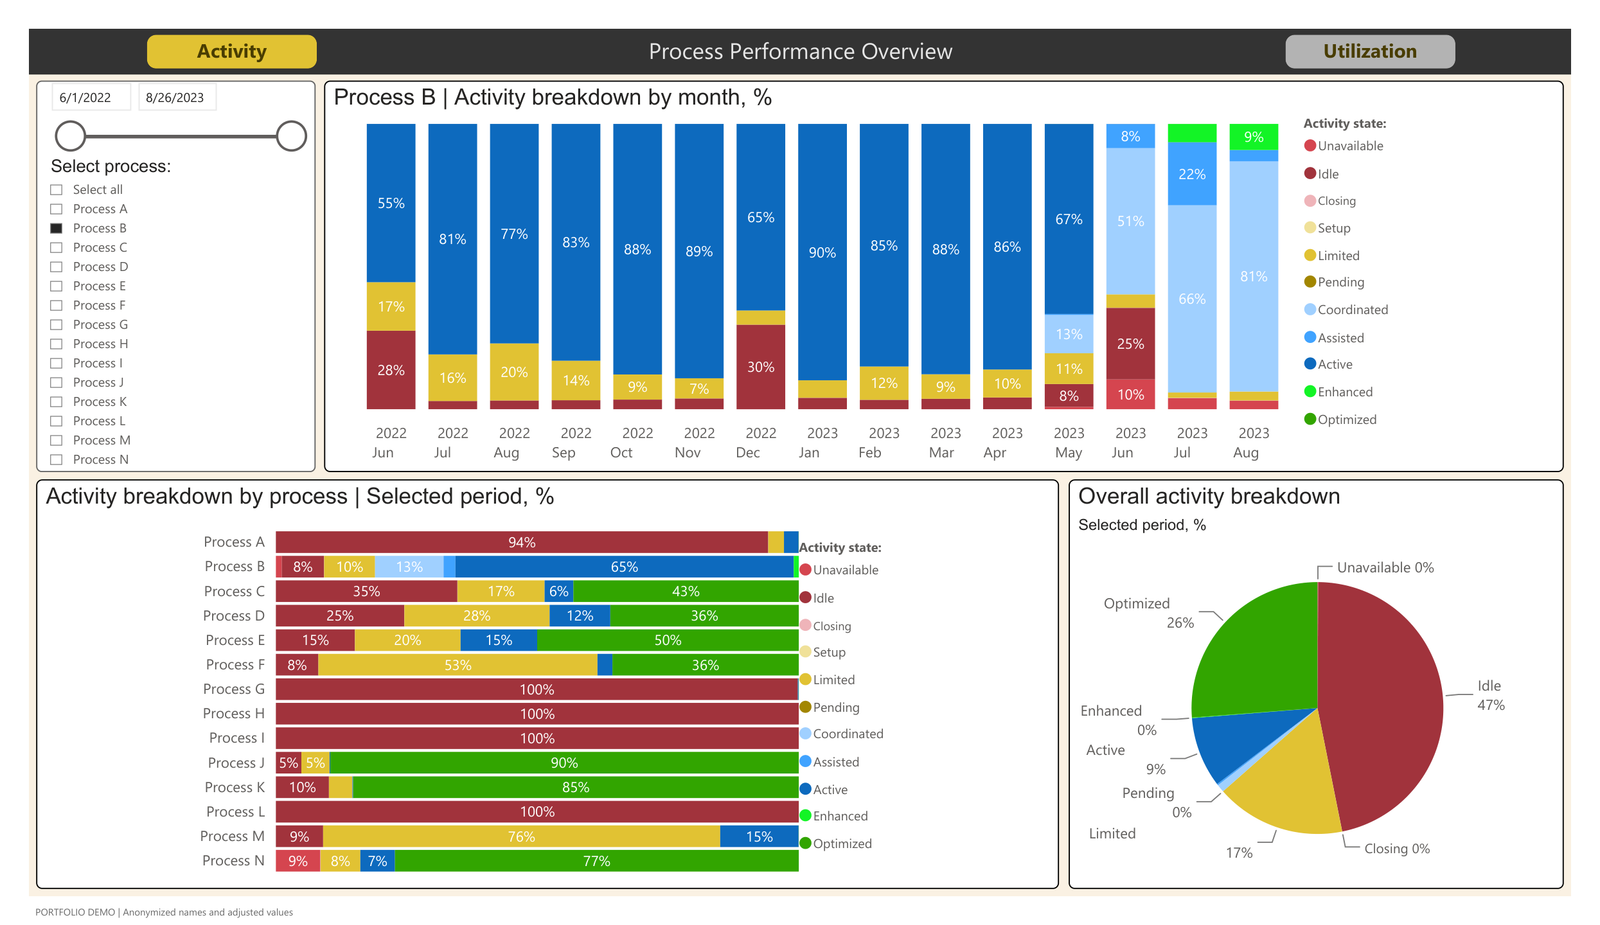
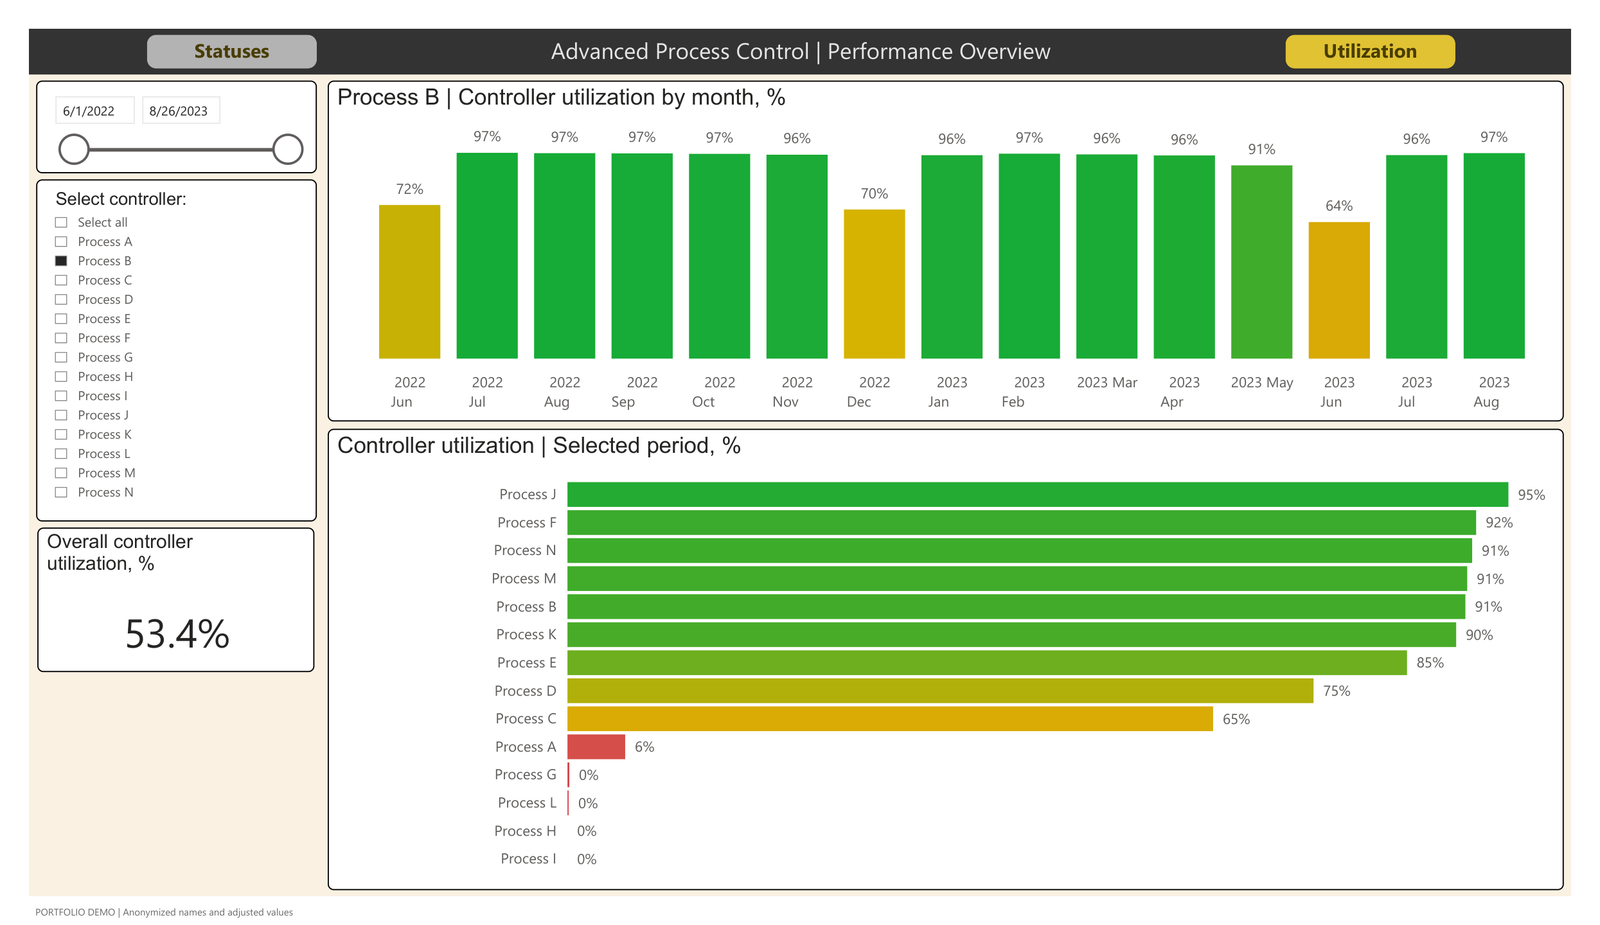
I structured the report around two complementary views: operating status and utilization. The status view shows how time is distributed across control, optimization, waiting, shutdown and other states. The utilization view compares controllers over the selected period and shows monthly changes for an individual controller.
This lets users move from the overall picture to a specific controller, compare it with other areas and examine whether low utilization coincides with a particular mix of operating states.
Outcome
The dashboard made it clearer to process engineers where to focus their attention. They could see a broader historical picture that had not been visible in their existing SCADA screens, compare areas consistently and use the findings to prioritize investigation and improvement work.
Broader analytics relevance
The core analytical problem is widely applicable: measuring how resources spend their time, comparing utilization and directing attention to exceptions. This project demonstrates KPI reporting, status-based segmentation, trend analysis and decision support. Those skills also apply to service operations, workflow monitoring, capacity analysis and asset performance reporting.
Screenshots are anonymized portfolio examples with adjusted dates and a slightly adjusted summary KPI. Benefits are qualitative; no unsupported productivity or financial impact is claimed.