Power BI · SQL · Time Series Analysis · Event Monitoring
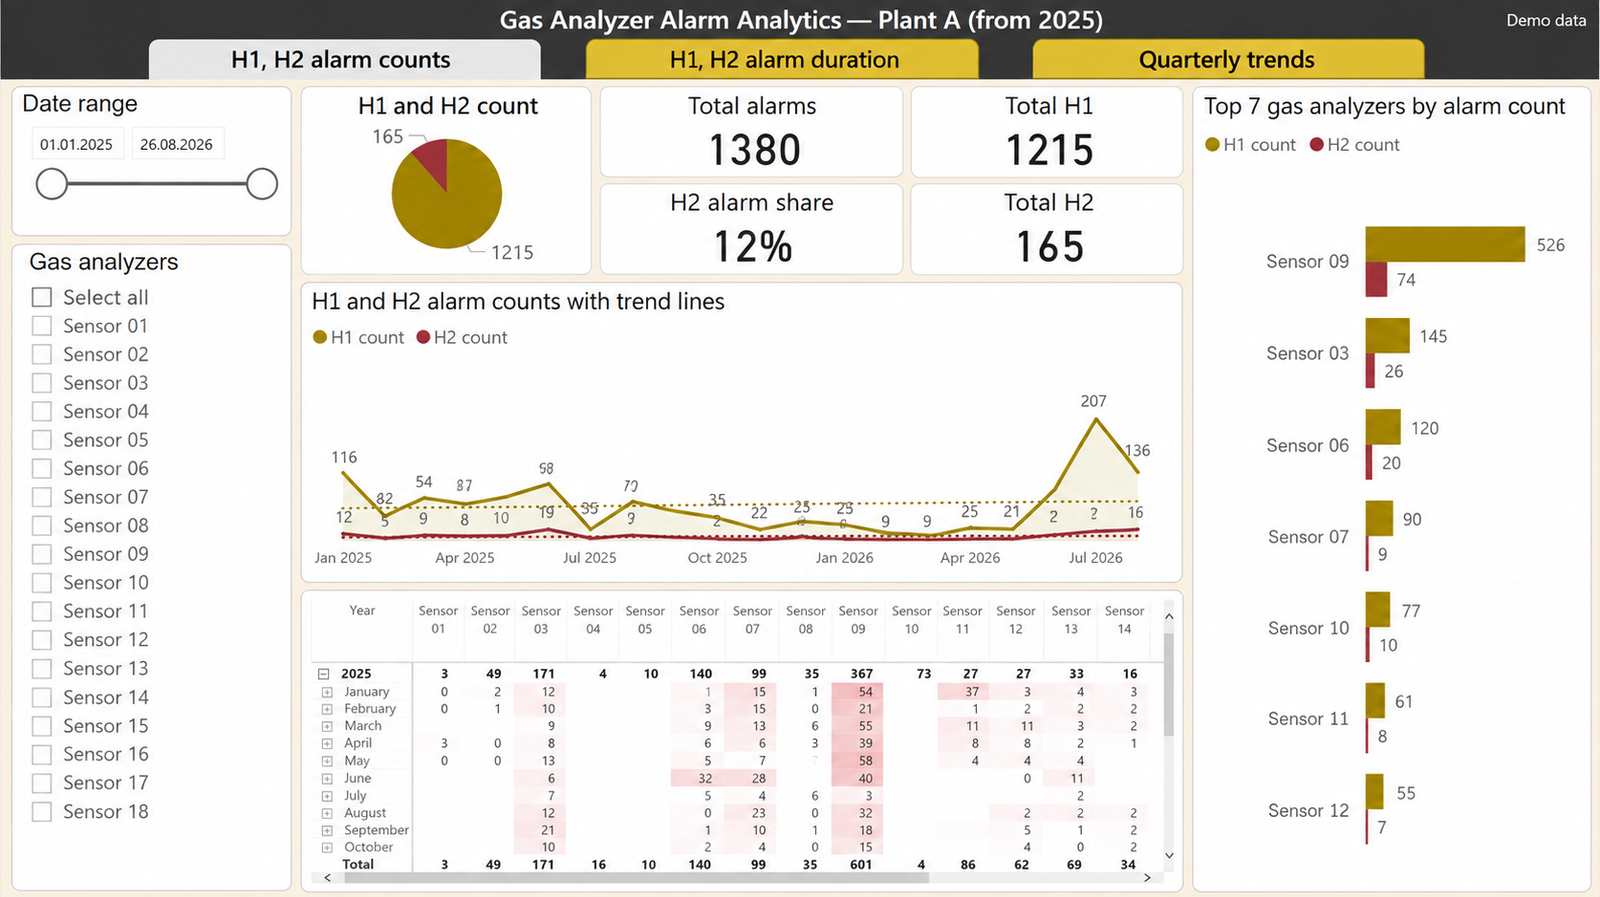
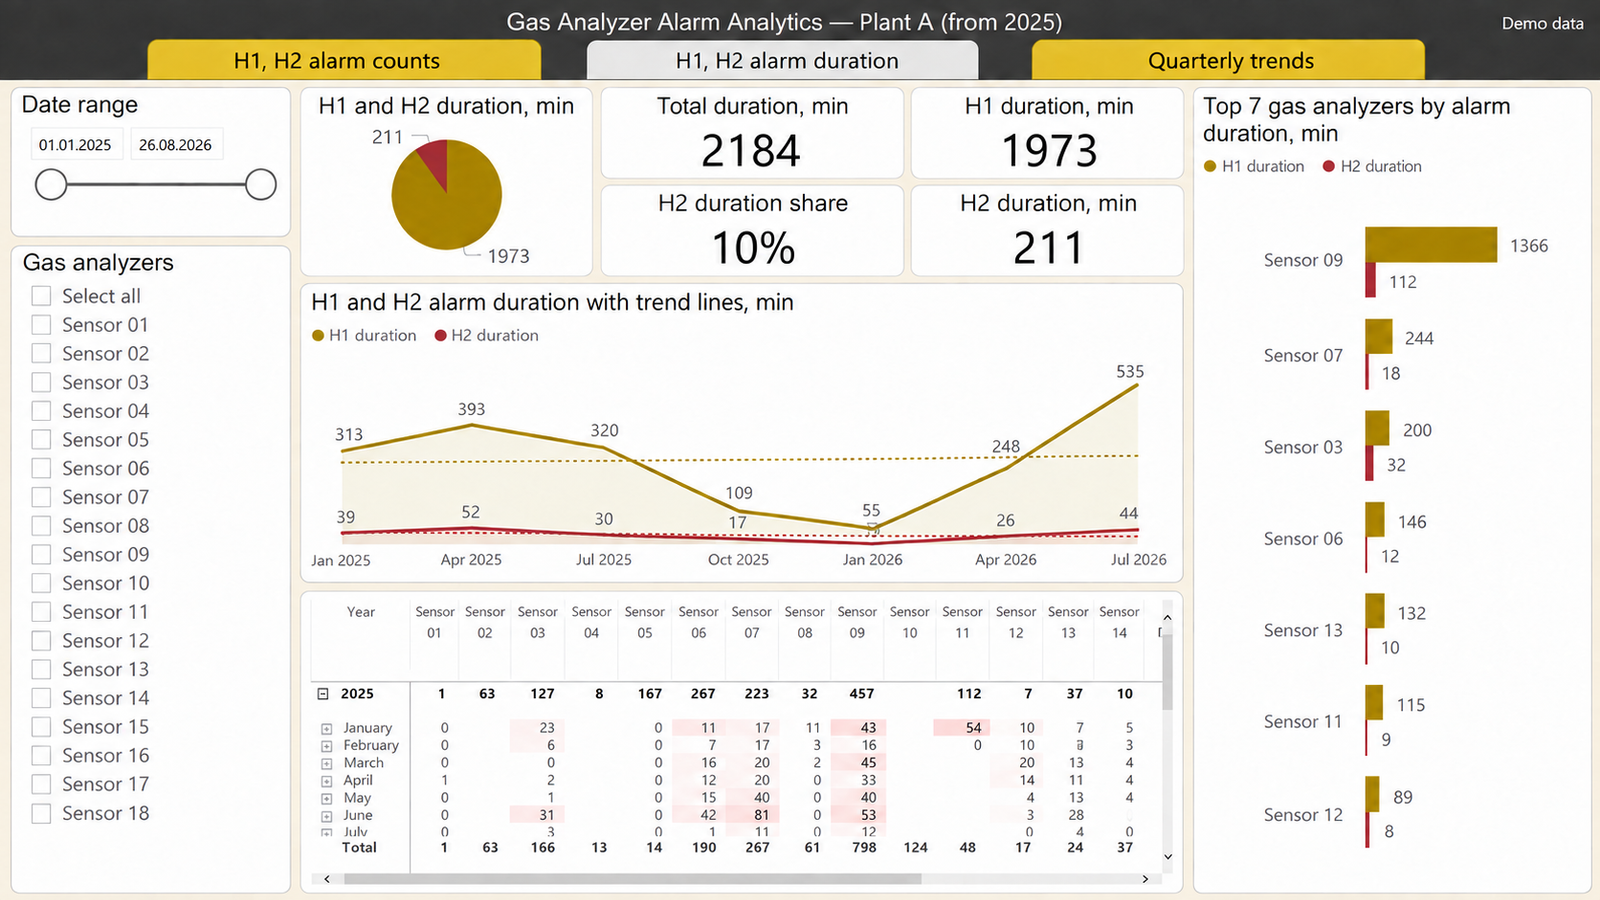
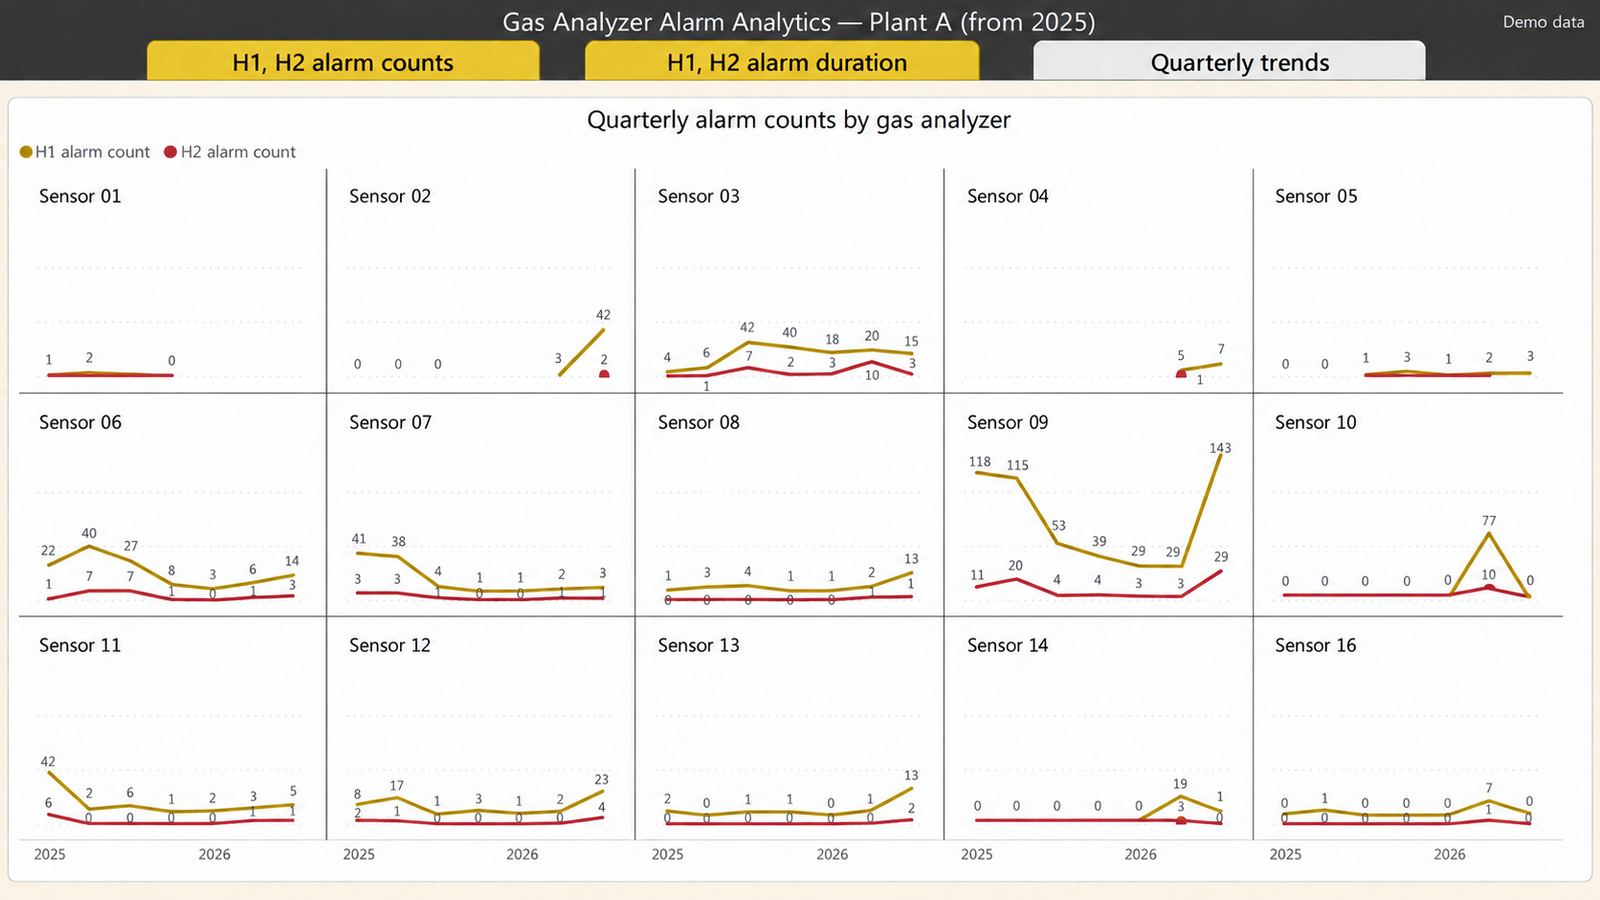
I built this report to explore alarm frequency and duration across multiple gas analyzers. It brings together an overview of two alarm levels, trends over time and a breakdown by individual sensor.
The report looks at both how often alarms occur and how long they last. These measures answer different questions: frequent short alarms and occasional prolonged alarms can produce very different patterns. Rankings and quarterly comparisons help identify which sensors need a closer look, while detailed tables allow users to explore individual periods.
SQL prepares the data for reporting, and Power BI provides date filters, sensor selection and visual comparisons.
Although this project uses sensor data, the same approach applies to other event-based data, such as service incidents, application errors, support escalations or equipment downtime. The underlying questions remain the same: what happens most often, what lasts longest, and how does the pattern change over time?
The screenshots use anonymized names and illustrative demo values. They show the report’s structure and analytical approach, rather than actual operational results.