Power BI · SQL Server · Process Control
I built this report to help examine how flotation control loops behaved in day-to-day operation. It brings together controller operating modes, deviations from setpoints, reagent dosing and key process measurements, so users can move from a plant-level overview to an individual controller.
Preparing the process data
The report uses minute-by-minute readings from PLCs, collected through OPC and a MES historian. I prepared the data in SQL Server and combined historical exports with the ongoing data feed. The original report refreshed every morning.
For each controller, the analysis connects the measured process value (PV), the setpoint (SP) and the operating mode. Daily summaries follow the plant’s production day, from 19:00 to 19:00.
Separating normal operation from downtime was an important part of the work. The analysis excludes plant stops and the first 45 minutes after a restart following a longer interruption. It also filters extreme percentage deviations from the deviation trends, keeping occasional spikes from making the rest of the chart unreadable.
Looking beyond an average
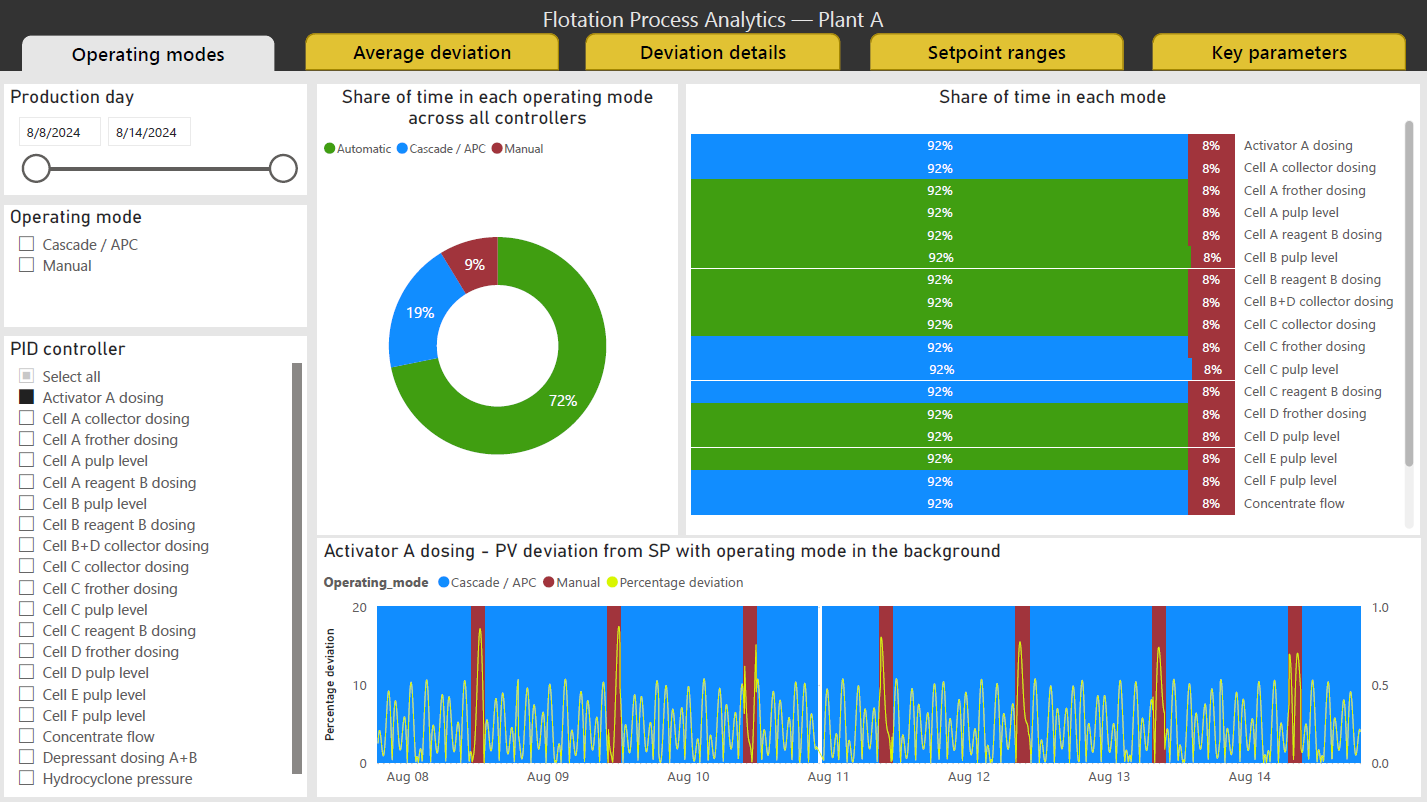
The report shows how much time controllers spend in automatic, cascade and manual modes. Users can select a controller and compare its operating mode with its deviation from the setpoint over time.
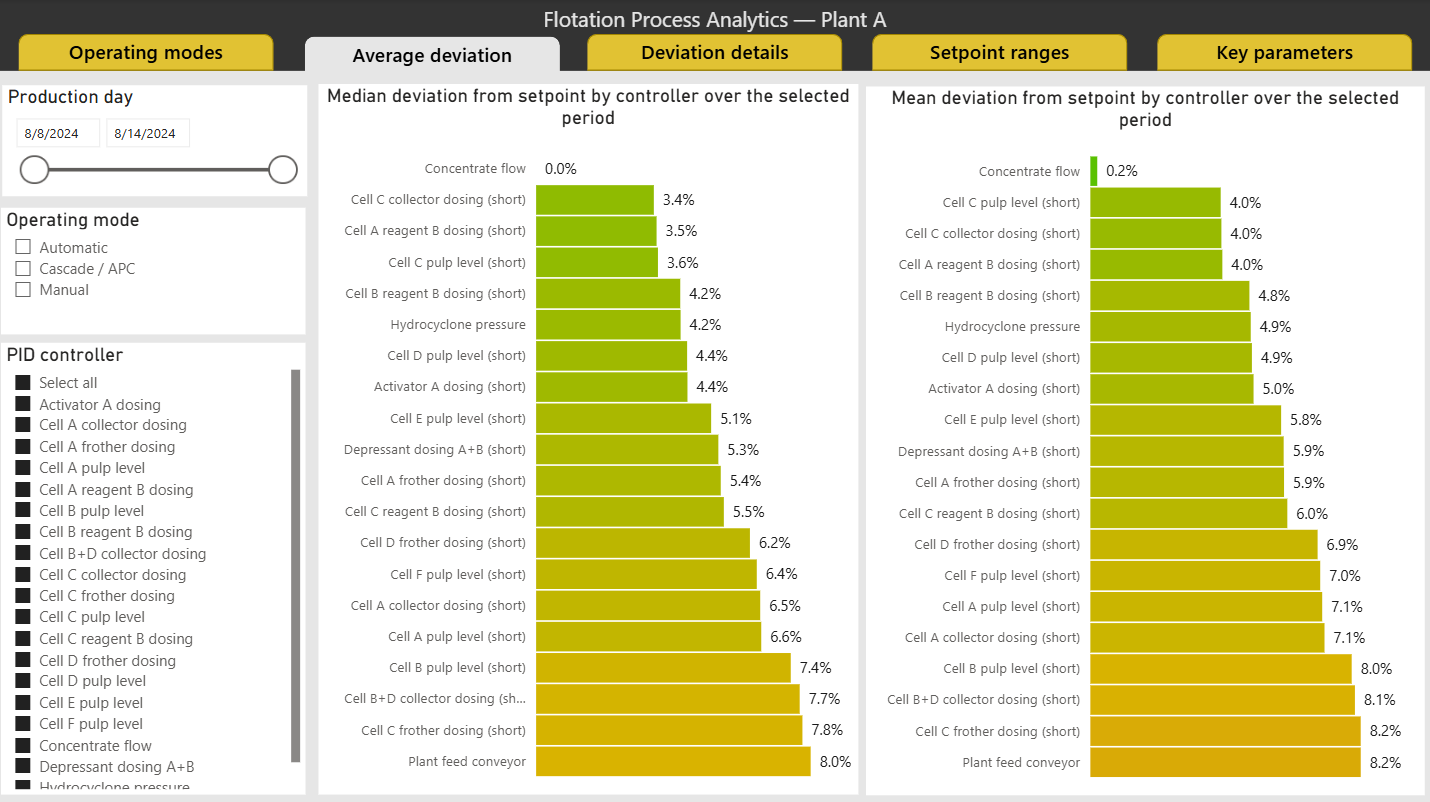
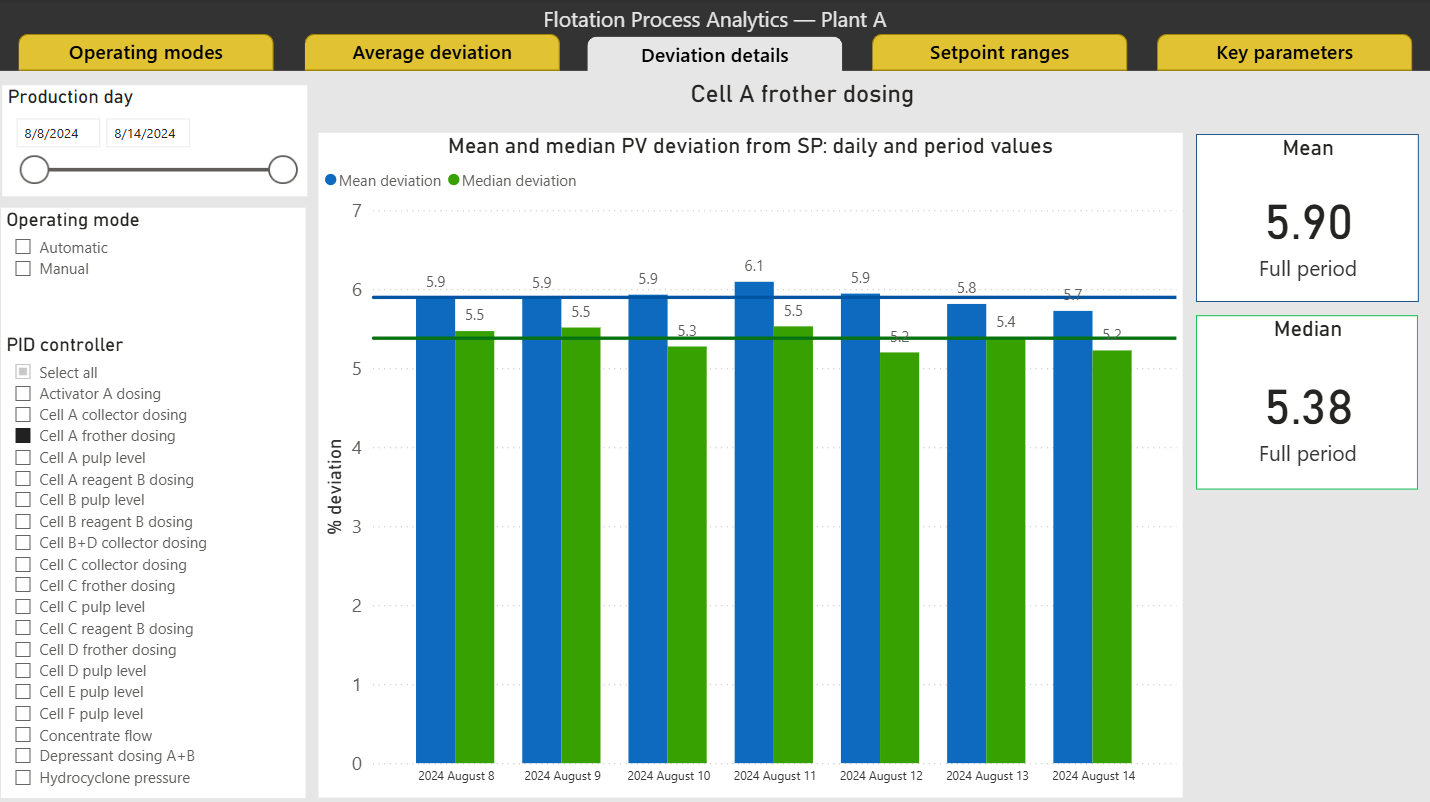
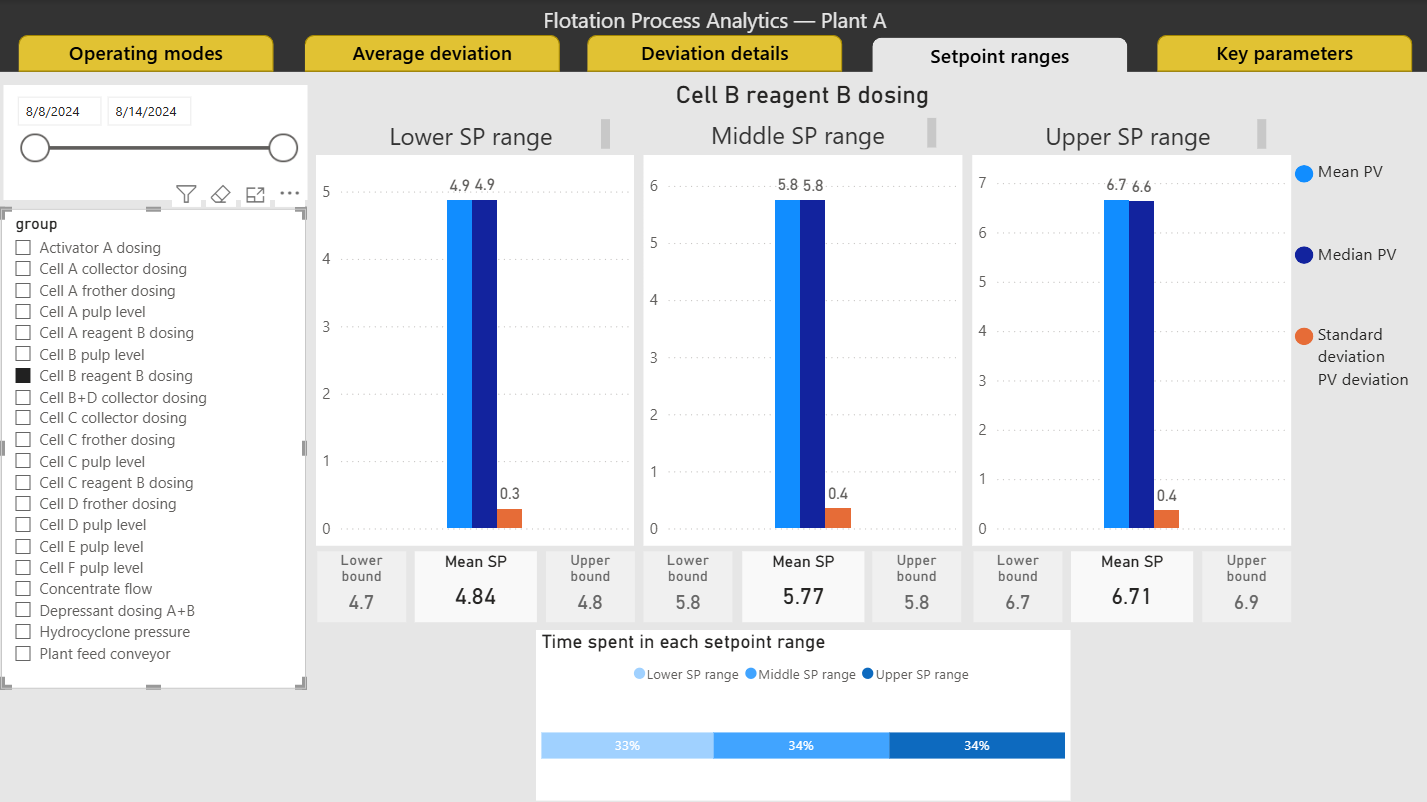
I included both mean and median deviation to help distinguish typical behaviour from the influence of large deviations. A separate page compares measured values across setpoint ranges, using the mean, median, standard deviation and number of observations to show how performance changes across operating conditions.
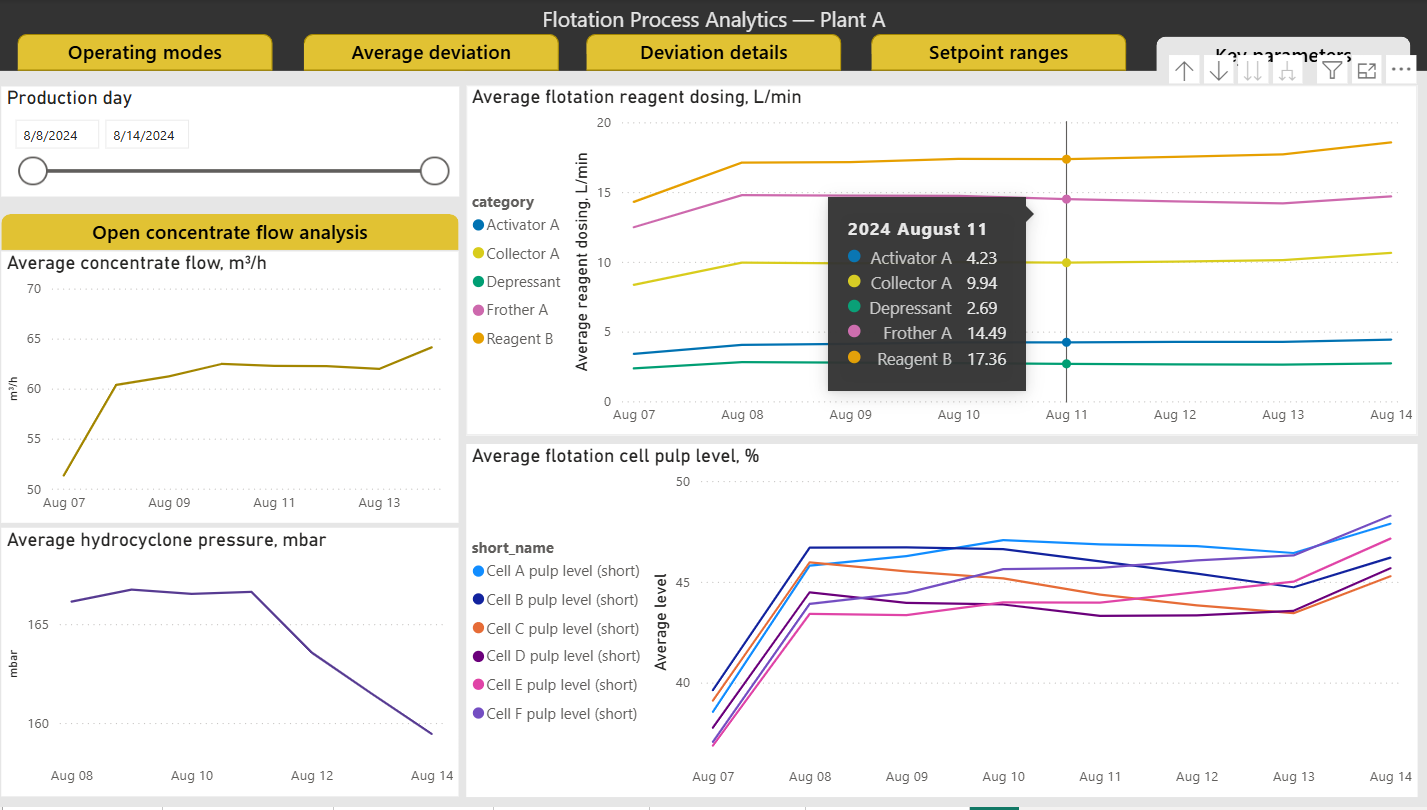
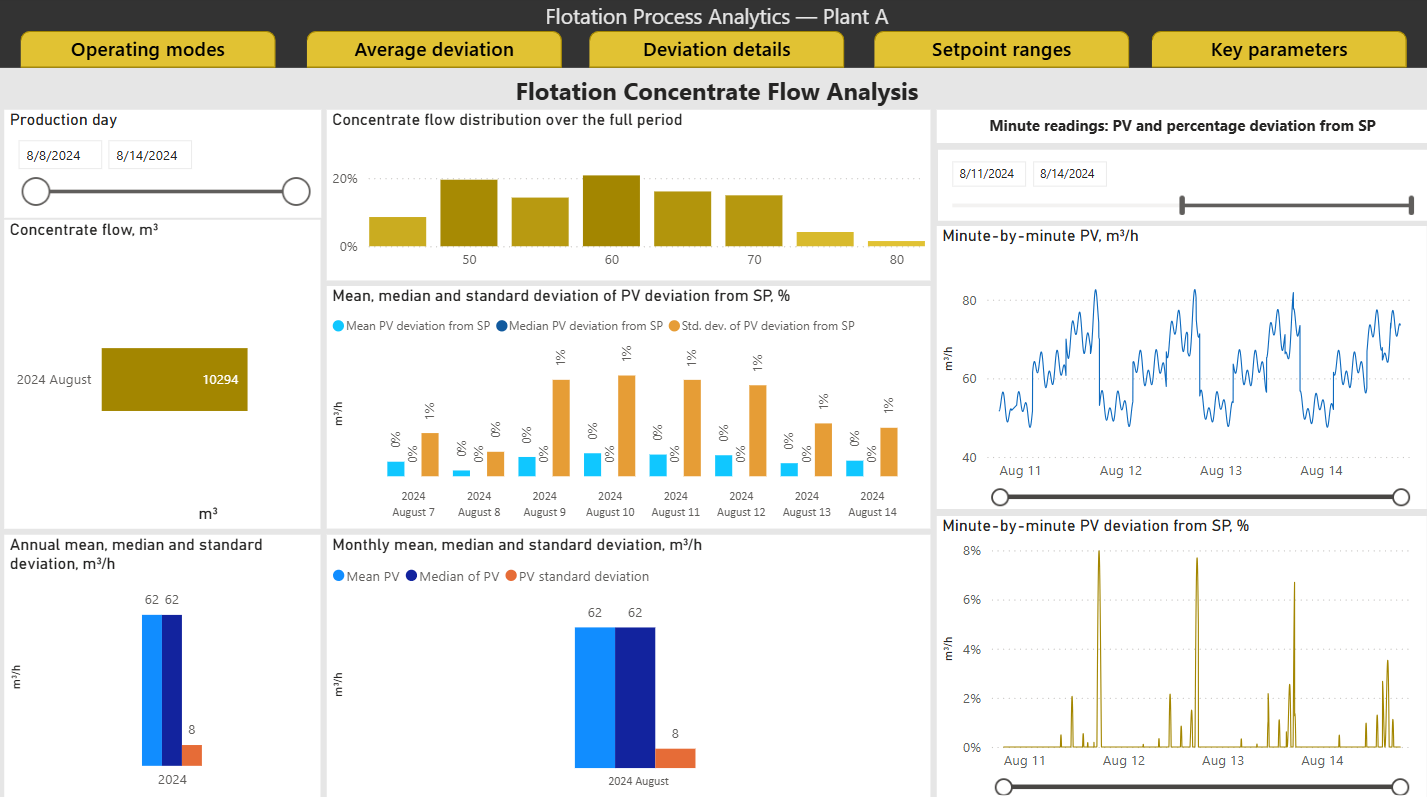
Other pages bring together reagent dosing, process measurements and flotation concentrate flow, with daily summaries and more detailed trends.
Handling a target range
Concentrate flow needed a different approach because the advanced process control system used an operating range rather than a single target. The range boundaries were not available in the historian.
I added an operator-entered midpoint tag to the data flow and used the known range width to reconstruct its boundaries. The analysis counts deviation only when the measured flow falls outside that range. This avoids treating acceptable movement within the operating band as a control error.
What the report makes easier
Users can identify controllers that spend more time in manual mode, compare control performance and investigate when deviations occur. The report provides a common view for reviewing process behaviour and deciding where closer investigation is needed.
This portfolio version uses synthetic data and anonymized identifiers. The original report design and calculation logic have been retained.